| PRODUCTO INTERNO BRUTO DE SANTANDER | |||||||||||||||||||
| ACTIVIDADES | 2005 | 2006 | 2007 | 2008 | 2009 | 2010 | 2011 | 2012 | 2013 | 2014 | 2015 | 2016 | 2017 | 2018 | Variación % | ||||
| 2017-2018 | |||||||||||||||||||
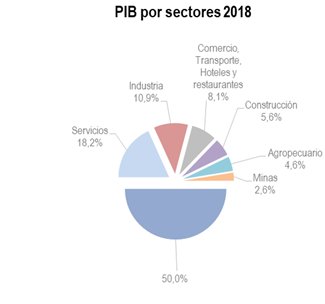
| <1> | Servicios | 9.706 | 10.433 | 10.928 | 11.539 | 11.831 | 12.376 | 12.973 | 13.239 | 13.873 | 14.683 | 15.229 | 15.608 | 16.054 | 16.528 | 3,0 | |||
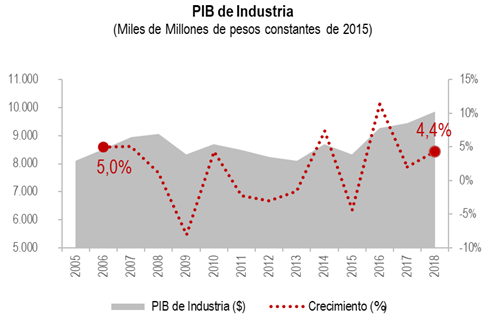
| <2> | Industria | 8.112 | 8.518 | 8.953 | 9.060 | 8.328 | 8.688 | 8.490 | 8.237 | 8.110 | 8.708 | 8.327 | 9.276 | 9.462 | 9.874 | 4,4 | |||
| <3> | Comercio, Transporte, Hoteles y restaurantes | 4.257 | 4.574 | 4.893 | 5.063 | 5.025 | 5.249 | 5.588 | 5.790 | 6.075 | 6.464 | 6.621 | 6.807 | 7.004 | 7.320 | 4,5 | |||
| <4> | Construcción | 2.012 | 2.212 | 2.658 | 3.014 | 3.377 | 4.014 | 4.625 | 5.311 | 6.031 | 7.056 | 6.246 | 6.027 | 5.574 | 5.061 | -9,2 | |||
| <5> | Agropecuario | 3.022 | 2.963 | 2.863 | 3.148 | 2.937 | 3.129 | 3.213 | 3.212 | 3.319 | 3.476 | 3.793 | 3.928 | 4.113 | 4.186 | 1,8 | |||
| <6> | Minas | 682 | 725 | 903 | 1.271 | 1.615 | 1.674 | 1.883 | 1.951 | 2.070 | 2.364 | 2.367 | 2.145 | 2.164 | 2.355 | 8,8 | |||
| Subtotal Valor Agregado | 27.721 | 29.385 | 31.292 | 33.133 | 33.133 | 35.242 | 36.815 | 37.690 | 39.300 | 42.798 | 42.583 | 43.792 | 44.395 | 45.352 | 2,2 | ||||
| Derechos e impuestos | 5.807 | 6.392 | 7.070 | 7.337 | 7.049 | 7.515 | 7.839 | 8.129 | 8.342 | 9.331 | 9.416 | 9.384 | 9.574 | 9.807 | 2,4 | ||||
| PIB TOTAL DEPARTAMENTAL | 33.528 | 35.774 | 38.353 | 40.471 | 40.212 | 42.786 | 44.685 | 45.841 | 47.680 | 52.135 | 51.999 | 53.175 | 53.970 | 55.155 | 2,2 | ||||
| Fuente: Dane - Valor agregado según actividad económica. | |||||||||||||||||||
| Cifras en miles de millones de pesos a precios constantes de 2015 - Cifras preliminares | |||||||||||||||||||
|
|
||||||||||||||||||