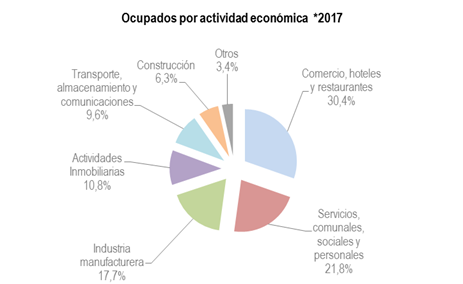
| OCUPADOS POR RAMA DE ACTIVIDAD ÁREA METROPOLITANA DE BUCARAMANGA | |||||||||||||||||||||||||||||
| Trimestre Móvil Octubre a Diciembre | |||||||||||||||||||||||||||||
| 2001 | 2002 | 2003 | 2004 | 2005 | 2006 | 2007 | 2008 | 2009 | 2010 | 2011 | 2012 | 2013 | 2014 | 2015 | 2016 | *2017 | |||||||||||||
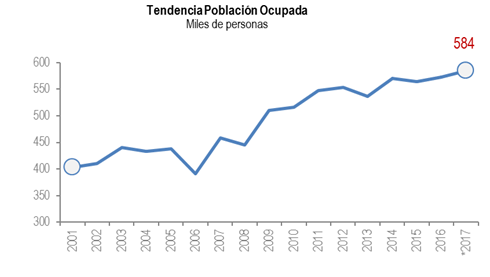
| Ocupados Bucaramanga | 404 | 410 | 440 | 434 | 438 | 391 | 458 | 446 | 510 | 516 | 548 | 553 | 536 | 571 | 565 | 572 | 584 | ||||||||||||
| Agricultura, pesca, ganadería, caza y silvicultura | 8 | 9 | 11 | 13 | 10 | 5 | 6 | 7 | 11 | 10 | 10 | 9 | 12 | 11 | 9 | 9 | 8 | ||||||||||||
| Explotación de Minas y Canteras | 1 | 2 | 1 | 2 | 3 | 2 | 1 | 2 | 3 | 1 | 2 | 1 | 1 | 1 | 1 | 1 | 1 | ||||||||||||
| Industria manufacturera | 89 | 96 | 108 | 99 | 103 | 84 | 110 | 102 | 103 | 97 | 113 | 104 | 91 | 98 | 102 | 99 | 104 | ||||||||||||
| Suministro de Electricidad Gas y Agua | 2 | 2 | 2 | 2 | 2 | 2 | 3 | 5 | 3 | 3 | 3 | 4 | 4 | 3 | 3 | 3 | 3 | ||||||||||||
| Construcción | 17 | 16 | 20 | 22 | 22 | 19 | 29 | 24 | 25 | 28 | 35 | 33 | 37 | 42 | 38 | 34 | 37 | ||||||||||||
| Comercio, hoteles y restaurantes | 131 | 124 | 134 | 138 | 142 | 123 | 136 | 133 | 163 | 158 | 166 | 178 | 173 | 191 | 175 | 180 | 177 | ||||||||||||
| Transporte, almacenamiento y comunicaciones | 36 | 38 | 37 | 34 | 37 | 41 | 42 | 39 | 49 | 57 | 57 | 50 | 56 | 56 | 54 | 56 | 56 | ||||||||||||
| Intermediación financiera | 10 | 8 | 7 | 6 | 8 | 7 | 6 | 7 | 8 | 6 | 7 | 10 | 9 | 9 | 9 | 10 | 8 | ||||||||||||
| Actividades Inmobiliarias | 22 | 20 | 23 | 24 | 25 | 27 | 37 | 41 | 46 | 45 | 46 | 50 | 49 | 53 | 56 | 60 | 63 | ||||||||||||
| Servicios, comunales, sociales y personales | 89 | 96 | 97 | 93 | 86 | 80 | 88 | 88 | 100 | 110 | 108 | 114 | 106 | 106 | 118 | 121 | 127 | ||||||||||||
| Fuente: DANE - Miles de personas | |||||||||||||||||||||||||||||
| Nota: (*) Corresponde al lll Trimestre de 2017 | |||||||||||||||||||||||||||||
|
|||||||||||||||||||||||||||||